
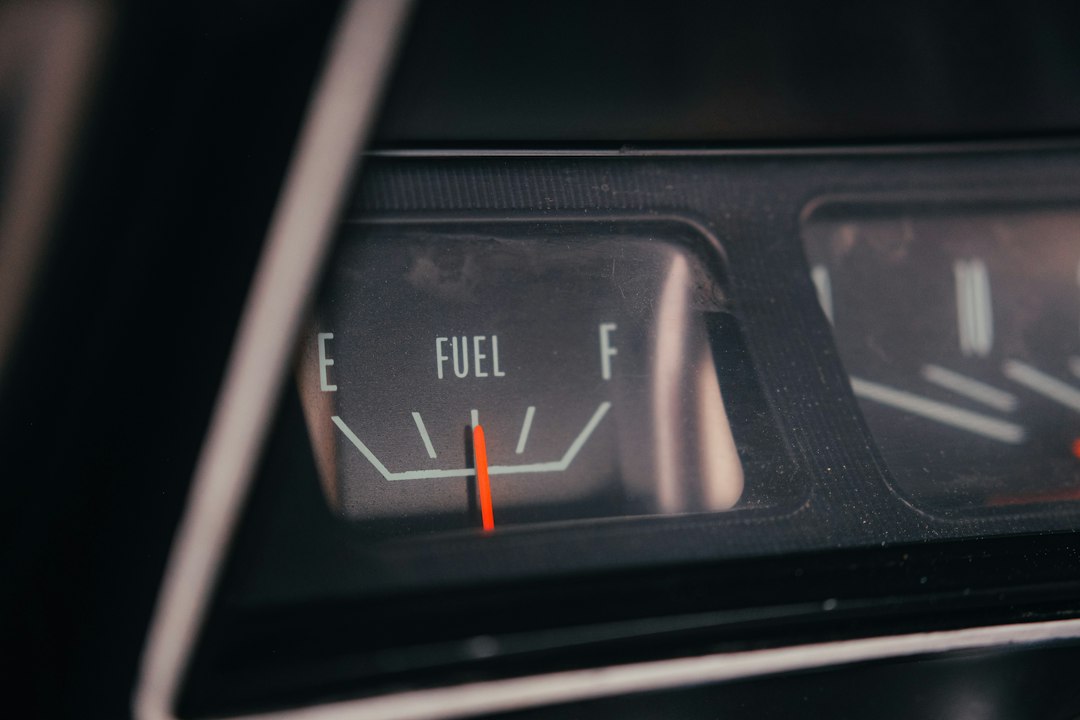
Quick answer: A used car advertised as ‘excellent on gas’ is not necessarily the cheapest vehicle to own. Fuel costs depend on the exact engine, transmission, drivetrain, gasoline grade and annual miles you actually drive. Official EPA estimates help compare vehicles under standardized conditions but cannot predict every driver’s results. Turn the published MPG into an annual expense, then compare the dollar difference with purchase price, insurance, maintenance and financing instead of choosing solely from a dashboard economy display.
Editorial method: This is evidence-oriented, original buyer guidance, not a claim that Car Focus tested the particular vehicles illustrated.
Use the exact EPA configuration
Start on FuelEconomy.gov with make, model, year, engine, transmission and drive type. Two trims of the same model can have different ratings, especially with AWD, sport engines or transmissions. The combined rating is a useful baseline, but city and highway figures may better match a particular commuter or delivery route.
Do not accept a seller’s screenshot of a favorable dashboard average as definitive lifetime performance. Trip computers can be reset and may cover an unusually efficient journey. Compare vehicles using the same official method first.
Convert ratings into annual gasoline volumes
Divide planned yearly miles by expected miles per gallon. At 12,000 miles annually, a car averaging 24 MPG consumes 500 gallons while one averaging 32 MPG uses 375 gallons. At an illustrative $3.50 per gallon, the fuel cost is $1,750 versus $1,312.50, or $437.50 difference per year.
These are arithmetic scenarios, not verified current gasoline prices or an MPG promise. If you drive only 4,000 miles, that fuel-volume difference becomes roughly one-third as large. Test both normal and high-mileage scenarios.
Gasoline grade changes the comparison
Some engines require premium gasoline while others only recommend it for best performance. Follow the exact owner’s manual rather than assuming a turbo badge always requires premium or that premium always improves efficiency. Use your local price for the prescribed grade in the worksheet.
A premium-fuel vehicle can have high EPA MPG but still cost more per mile than a lower-rated regular-gas alternative if the price gap is large. Also check tank size and actual refueling convenience for long-distance use.
Your route and weather change real MPG
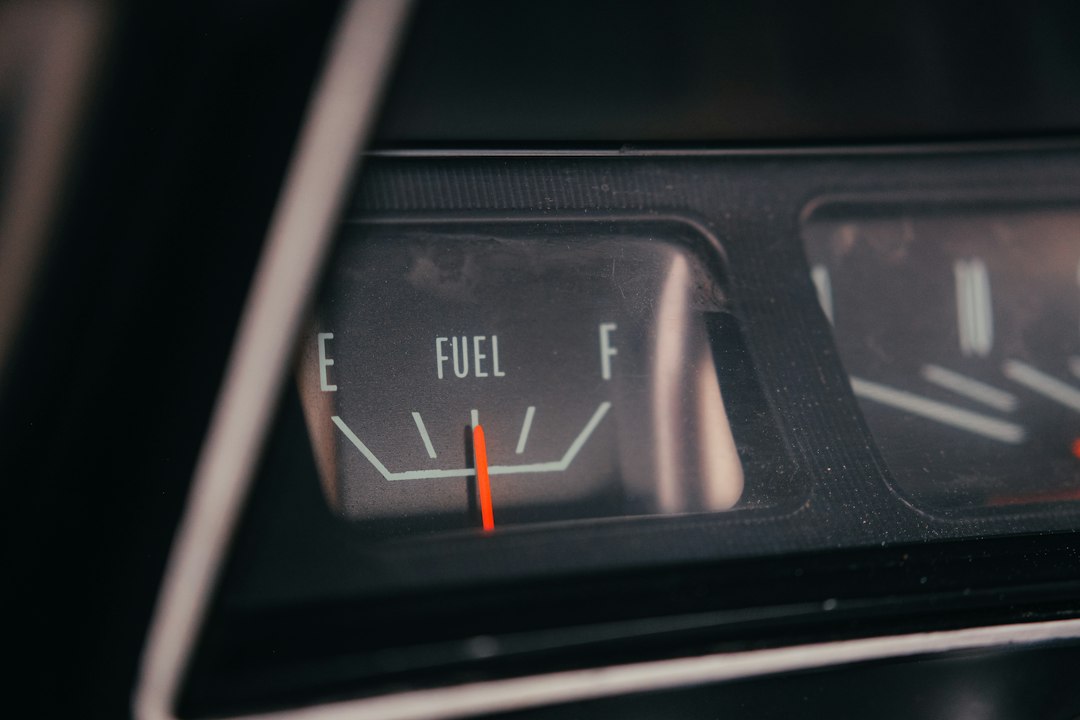
Repeated cold starts, idling, high speed, towing, roof cargo, hills and temperature conditions can affect results. Winter tire choices and air-conditioning use can also change consumption. Official estimates standardize one basis of comparison rather than guaranteeing a result in your commute.
For gig driving, idle and repositioning miles can make observed fuel spending differ from simple paid-mile assumptions. Track odometer distance and gallons for multiple fill-ups if you already own the vehicle.
Compare hybrid gains against purchase price
Hybrids can provide strong city economy, but battery-system inspection, initial purchase premium and insurance remain relevant. A more expensive hybrid may save fuel without fully offsetting its extra initial cost within your expected ownership period. Conversely, a competitively priced hybrid may produce meaningful savings for a high-mileage commuter.
Compare our hybrid-versus-gas guide and hybrid battery assessment. Do not treat battery failure as guaranteed or impossible.
Put fuel into total ownership cost
Include tires, brakes, service, insurance, financing and resale. For example, a hypothetical $3,000 purchase premium divided by $400 annual fuel savings takes 7.5 years to offset by fuel alone, assuming those numbers hold. Repair and resale differences can alter that conclusion completely.
Do not count depreciation and a full financed principal repayment as separate economic expenses without clarifying your method. If you need cash-flow budgeting, calculate actual payments separately from value loss.
Used-car condition still matters
An efficient model with dragging brakes, underinflated tires or engine problems can cost more to operate than intended. A pre-purchase inspection can identify visible defects and repair needs. A promising EPA estimate does not verify the car’s actual mechanical state.
Use the tire inspection checklist and documented maintenance history. Obtain quotes for urgent work and add them to the final cost comparison.
Create your personal fuel budget
Pick two or three candidate cars. Record their official economy, annual miles, fuel grade and local price. Calculate expected annual cost plus a conservative lower-MPG scenario. Compare results over the same ownership period and assess the extra capital required to buy each model.
The best option is the vehicle that satisfies your transportation requirements with acceptable total cost, not necessarily the highest headline MPG. For work use, see our delivery-driver cost-per-mile calculator framework.
Buyer verification table
| Example metric | Car A | Car B |
|---|---|---|
| Annual driving | 12,000 mi | 12,000 mi |
| Estimated MPG | 24 | 32 |
| Gasoline used | 500 gal | 375 gal |
| Illustrative price | $3.50/gal | $3.50/gal |
| Illustrative yearly fuel | $1,750 | $1,312.50 |
Frequently asked questions
Are EPA MPG figures guaranteed?
No. They are standardized estimates, not individualized promises.
Does premium gasoline always increase MPG?
No. Follow the vehicle’s required fuel grade and official ratings.
Is the higher MPG used car always cheapest overall?
No. Account for price, depreciation and all other costs.